Combined APEX chart with ORDERS table
Last modified on October 2, 2026 • 1 min read • 144 wordsThis demo is base on the standard demo tables ORDERS et ORDER_ITEMS.
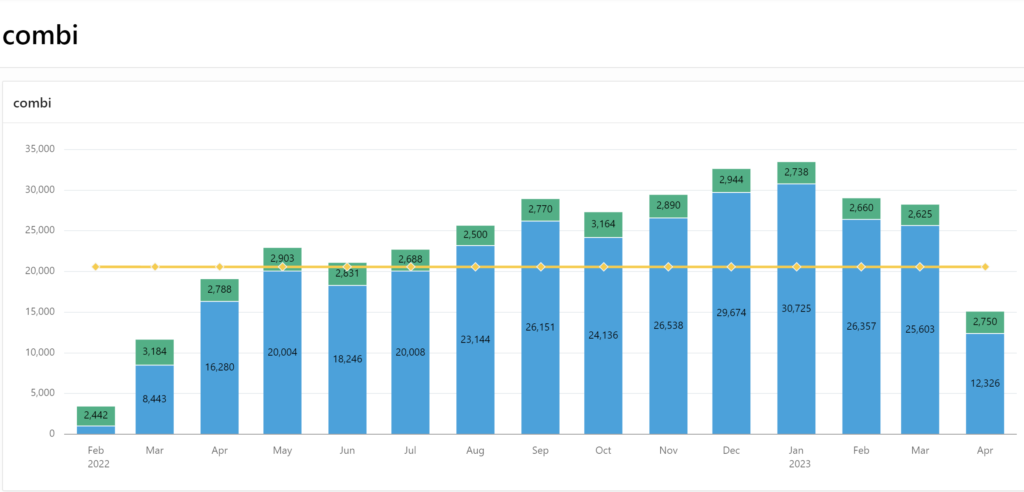
The goal is to produce a chart with a monthly amount stacked with variance and a average monthly amount.
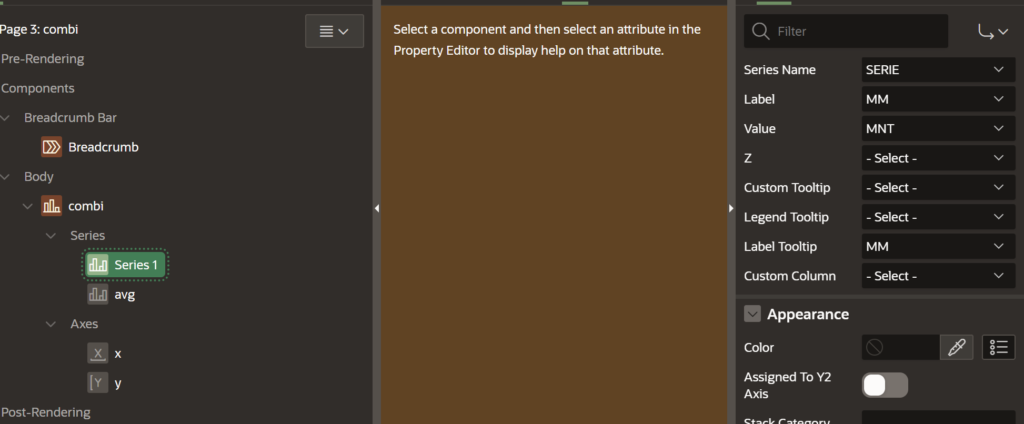
Build a combined chart and and two series from the tow following queries
Statement 1: implemented as a Stacked bar serie
select mm, b.mnt, 'mnt' serie from(select trunc(order_datetime,'MM') mm,sum((unit_price *quantity)) mnt,trunc(variance((unit_price *quantity)),2) varifrom orders d,order_items iwhere i.order_id = d.order_idgroup by trunc(order_datetime,'MM')order by 1) bUNIONselect mm, b.mnt , 'variance' serie from(select trunc(order_datetime,'MM') mm,trunc(variance((unit_price *quantity)),2) mntfrom orders d,order_items iwhere i.order_id = d.order_idgroup by trunc(order_datetime,'MM')order by 1) bStatement 2: implemented as a line serie
select b.mm,a.avgi, b.mnt, b.vari from( select trunc(avg(mnt),2) avgifrom (select trunc(order_datetime,'MM') mm,sum((unit_price *quantity)) mntfrom orders d,order_items iwhere i.order_id = d.order_idgroup by trunc(order_datetime,'MM'))) a,(select trunc(order_datetime,'MM') mm,sum((unit_price *quantity)) mnt,trunc(variance((unit_price *quantity)),2) varifrom orders d,order_items iwhere i.order_id = d.order_idgroup by trunc(order_datetime,'MM')order by 1) b